> ## Documentation Index
> Fetch the complete documentation index at: https://trakkr.mintlify.site/llms.txt
> Use this file to discover all available pages before exploring further.
# CSV Exports
> Export your Trakkr visibility data to CSV files for offline analysis and custom reporting
CSV Exports are available on all paid plans (Growth and Scale). [Upgrade to access](/plans)
## Overview
CSV Exports let you download your Trakkr data in flexible formats for offline analysis, custom reporting, or integration with other tools. Choose from three export types depending on your needs.
### When to Use CSV Exports
CSV Exports are ideal for:
* **One-time analysis** - Download data when you need it, not on a schedule
* **Offline work** - Analyze data in Excel, R, Python, or other offline tools
* **Custom date ranges** - Export specific time periods for reports
* **Flexibility** - Mix and match export types for different needs
* **No automation needed** - Manual exports when you need them
### Consider These Alternatives
**Better for**: Daily auto-sync, team collaboration, always-current data
**Better for**: Automated workflows, custom integrations, real-time access
## Export Types
### Top-Level
**Best for**: Executive dashboards, trend analysis, and high-level reporting
A comprehensive overview of brand performance over time, ideal for executive dashboards and trend analysis.
**Columns included**:
* **Date**: Daily timestamp
* **Brand**: Your brand name
* **Visibility**: Daily visibility score
* **Presence**: Daily presence score
This export provides a clean, aggregated view perfect for building charts and graphs that show performance trends over time.
### Detailed
**Best for**: In-depth analysis, prompt-level optimization, and content strategy
Focused analysis of your primary brand's ranking performance across different prompts and models.
**Columns included**:
* **Date**: Daily timestamp
* **Prompt**: The specific prompt tracked
* **Tag**: Prompt category/tag (if enabled)
* **Model**: AI model that generated the response
* **Rank**: Your brand's ranking position
This export shows individual prompt-model pairings, allowing you to identify which prompts perform well and which need optimization.
### Raw Data
**Best for**: Competitive intelligence, market analysis, and comprehensive data science projects
Complete competitive intelligence with full rankings from every AI response.
**Columns included**:
* **Date**: Daily timestamp
* **Prompt**: The specific prompt tracked
* **Tag**: Prompt category/tag (if enabled)
* **Model**: AI model that generated the response
* **Rank1** through **Rank10**: Brands ranked in positions 1-10
This export provides the most comprehensive data, showing not just your performance but the complete competitive landscape for every prompt and model.
## Creating an Export
Go to **Integrations** → **CSV Exports**.
Select **Top-Level**, **Detailed**, or **Raw Data** based on your needs.
See which columns will be included in your export to ensure it matches your requirements.
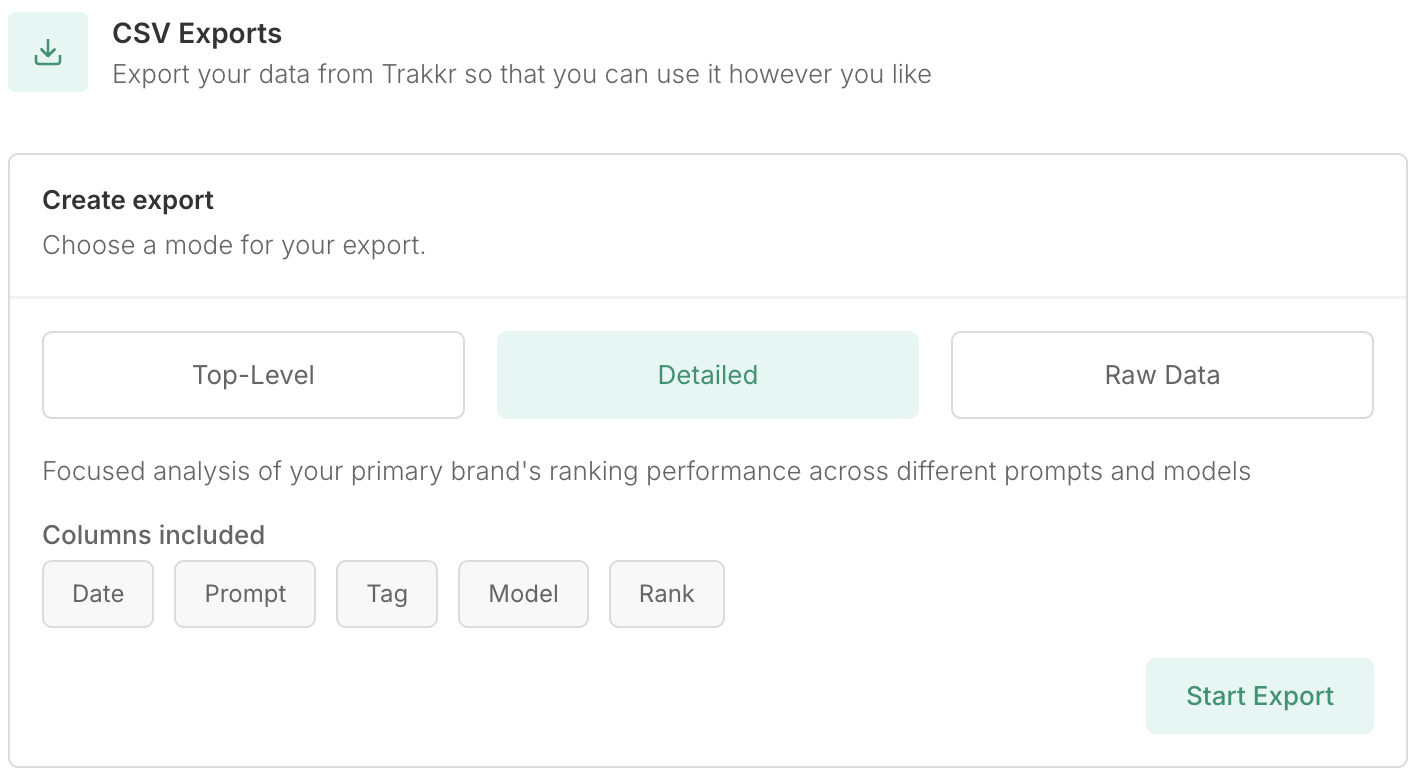 Click **Start Export**. The export typically completes within 30 seconds.
## Managing Exports
### Viewing Previous Exports
All your generated exports appear in the **\[Brand]'s exports** section below the creation form.
Click **Start Export**. The export typically completes within 30 seconds.
## Managing Exports
### Viewing Previous Exports
All your generated exports appear in the **\[Brand]'s exports** section below the creation form.
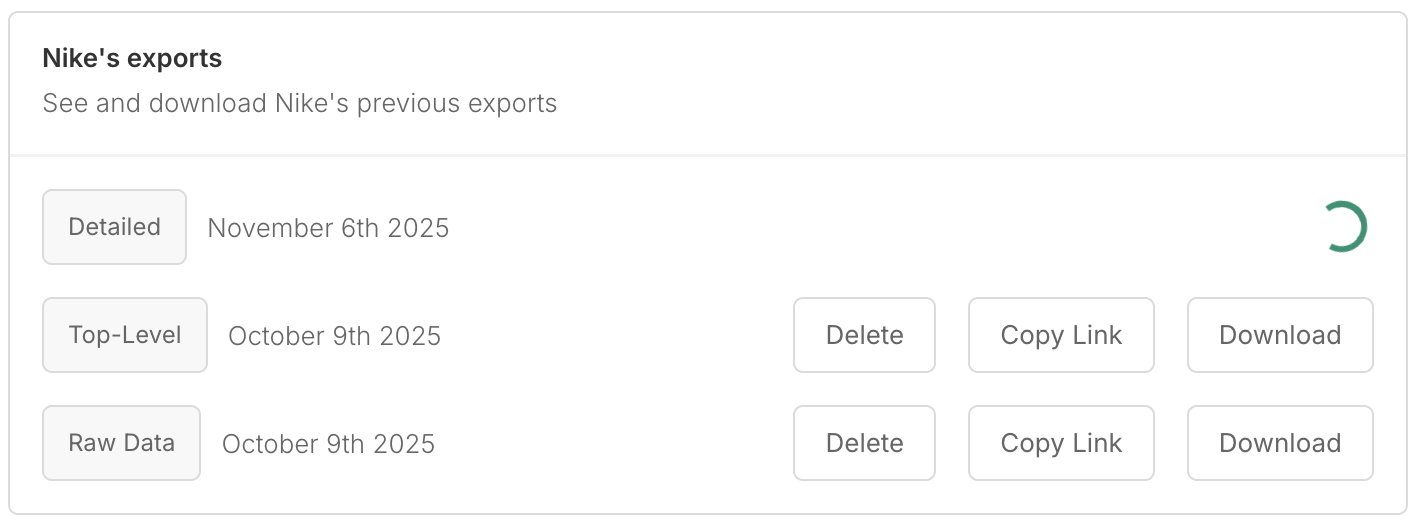 For each export, you can:
* **Download**: Save the CSV file to your computer
* **Copy Link**: Get a shareable link to the export file
* **Delete**: Remove the export from your account
Export files are automatically deleted after 30 days. Download important exports for long-term storage.
### Export Retention
* **Storage period**: 30 days from creation
* **File format**: Standard CSV (comma-separated values)
* **Naming**: Exports are labeled by type and creation date
## Use Cases
Use **Top-Level** exports to create executive dashboards in Excel, Tableau, or PowerPoint. Show visibility and presence trends over time with clean, aggregated data.
Use **Detailed** exports to identify which prompts need improvement. Filter by tag to analyze category performance and prioritize content updates.
Use **Raw Data** exports to understand the complete competitive landscape. Identify which competitors consistently outrank you and on which prompts.
Use **Raw Data** exports for machine learning or statistical analysis. The comprehensive dataset includes all competitors and historical performance.
Agencies can use **Top-Level** exports to create client reports showing performance improvements over time. Combine with competitive data from **Raw Data** exports.
## Tips for Working with CSV Exports
### Data Analysis
* **Pivot tables**: Use Excel or Google Sheets pivot tables to aggregate and analyze data
* **Charts**: Create time-series charts to visualize visibility and presence trends
* **Filtering**: Filter by date range, prompt, or model to focus on specific insights
### Combining Export Types
Consider using multiple export types for comprehensive analysis:
1. **Top-Level** for overall trend visualization
2. **Detailed** for prompt-specific optimization
3. **Raw Data** for competitive intelligence
### Automation
For automated data pipelines, consider using the [API](/api) or [Google Sheets sync](/google-sheets) instead of manual CSV exports.
## Troubleshooting
### Export Taking Too Long
Exports typically complete within 30 seconds. If an export takes longer:
* Check your internet connection
* Refresh the page to see if the export has completed
* Try creating a new export if the first attempt fails
### Missing Data
If your export appears incomplete:
* Ensure you have tracking data for the selected time period
* Verify that prompts are active and running
* Check that you're on a paid plan (required for exports)
### File Format Issues
If you encounter issues opening CSV files:
* Ensure you're using a compatible application (Excel, Google Sheets, etc.)
* Check that the file extension is `.csv`
* Try opening with a text editor to verify the file structure
## Related Integrations
Automate data exports with daily Google Sheets sync
Build custom integrations with programmatic API access
Create interactive dashboards with Looker Studio
For each export, you can:
* **Download**: Save the CSV file to your computer
* **Copy Link**: Get a shareable link to the export file
* **Delete**: Remove the export from your account
Export files are automatically deleted after 30 days. Download important exports for long-term storage.
### Export Retention
* **Storage period**: 30 days from creation
* **File format**: Standard CSV (comma-separated values)
* **Naming**: Exports are labeled by type and creation date
## Use Cases
Use **Top-Level** exports to create executive dashboards in Excel, Tableau, or PowerPoint. Show visibility and presence trends over time with clean, aggregated data.
Use **Detailed** exports to identify which prompts need improvement. Filter by tag to analyze category performance and prioritize content updates.
Use **Raw Data** exports to understand the complete competitive landscape. Identify which competitors consistently outrank you and on which prompts.
Use **Raw Data** exports for machine learning or statistical analysis. The comprehensive dataset includes all competitors and historical performance.
Agencies can use **Top-Level** exports to create client reports showing performance improvements over time. Combine with competitive data from **Raw Data** exports.
## Tips for Working with CSV Exports
### Data Analysis
* **Pivot tables**: Use Excel or Google Sheets pivot tables to aggregate and analyze data
* **Charts**: Create time-series charts to visualize visibility and presence trends
* **Filtering**: Filter by date range, prompt, or model to focus on specific insights
### Combining Export Types
Consider using multiple export types for comprehensive analysis:
1. **Top-Level** for overall trend visualization
2. **Detailed** for prompt-specific optimization
3. **Raw Data** for competitive intelligence
### Automation
For automated data pipelines, consider using the [API](/api) or [Google Sheets sync](/google-sheets) instead of manual CSV exports.
## Troubleshooting
### Export Taking Too Long
Exports typically complete within 30 seconds. If an export takes longer:
* Check your internet connection
* Refresh the page to see if the export has completed
* Try creating a new export if the first attempt fails
### Missing Data
If your export appears incomplete:
* Ensure you have tracking data for the selected time period
* Verify that prompts are active and running
* Check that you're on a paid plan (required for exports)
### File Format Issues
If you encounter issues opening CSV files:
* Ensure you're using a compatible application (Excel, Google Sheets, etc.)
* Check that the file extension is `.csv`
* Try opening with a text editor to verify the file structure
## Related Integrations
Automate data exports with daily Google Sheets sync
Build custom integrations with programmatic API access
Create interactive dashboards with Looker Studio